Dashboard via Microsoft Power BI
The AutomotiveINNOVATIONS dashboard provides an exclusive overview of the innovation activity of the global automotive industry with over 100 automobile brands. It enables companies to analyze current developments in the industry and gain valueable information on future trends based on more than 20,000 individually evaluated innovations.
The Dashboard is based on our continously updated AutomotiveINNOVATIONS database and can be licenced by the Center of Automotive Management.
AutomotiveINNOVATIONS Dashboard – The innovation portal of the global automotive industry
Click here for preview via
Microsoft Power BI dashboard
Dashboard examples
Analysis on OEM Level (examples)
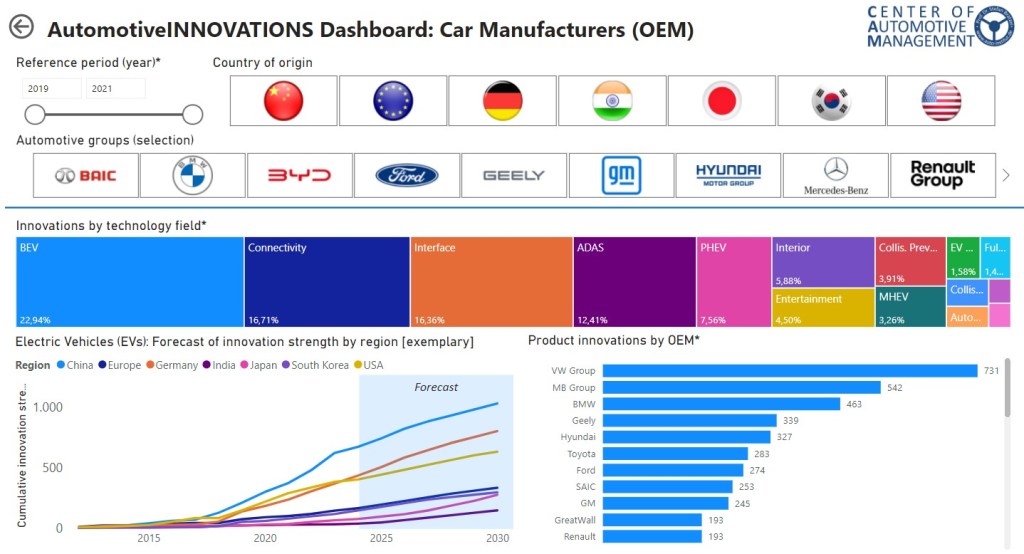
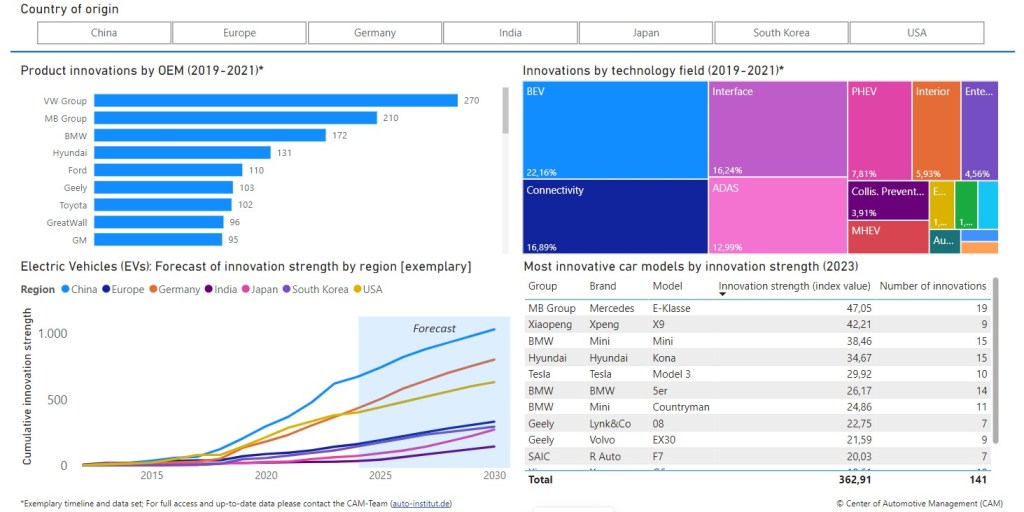
- Number of innovations by OEMs
- Strength of OEMs in technology fields
- Forecast of innovation strength by region
- Most innovative car models of OEMs and technology fields
Analysis on Technology Level (examples)
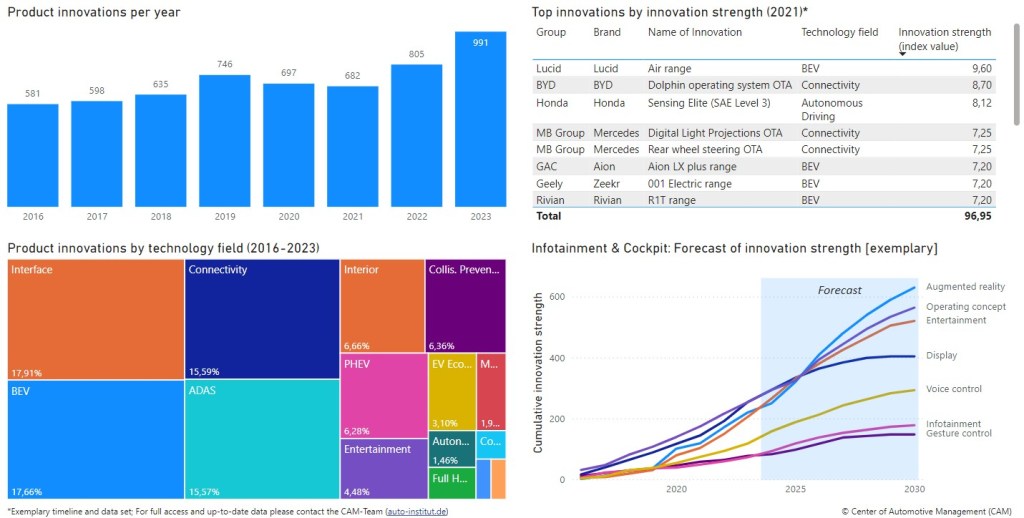
- World-first product innovations by technology field
- Top innovations by year (CAM-rated per innovation strength)
- innovation trends of specific technology fields
- Forecast of innovation strength by technology field
Technology Deep Dive (examples)
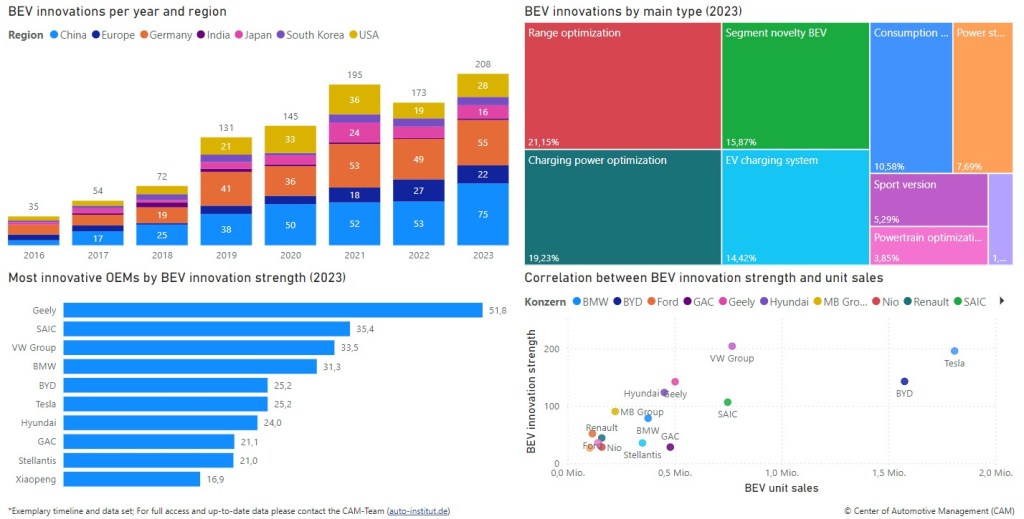
- For each technology field deep dives are possible. Example here: Battery Electric Vehicles (BEV)
- Distribution by main innovation types (e.g. range/ charging power/ consumption optimization)
- Correlation between BEV innovation strength and unit sales
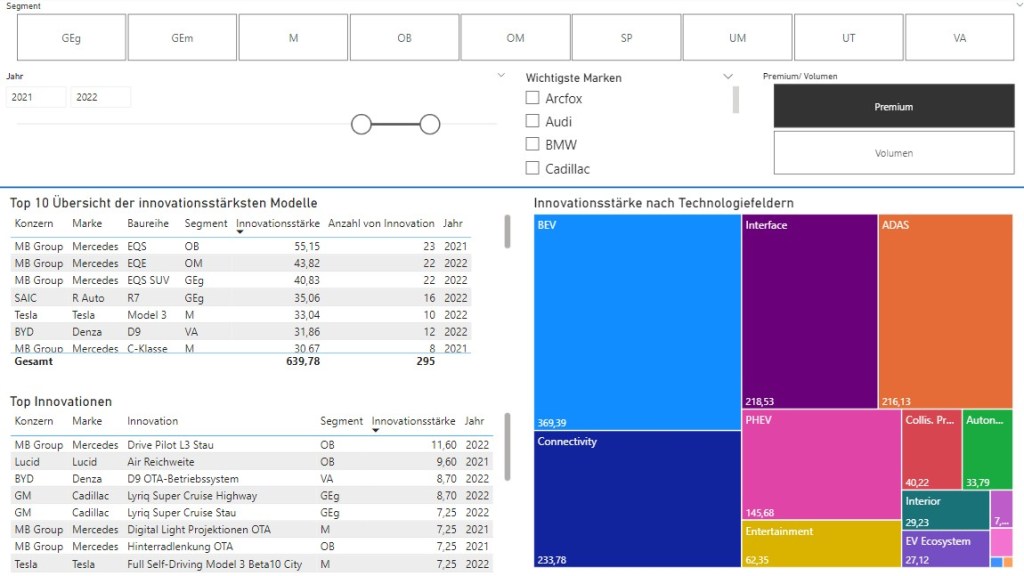
Analysis on Vehicle Segment Level (examples)
- All innovations are broken down by vehicle segment, e.g. compact cars, medium sized SUVs, vans etc.
- Differentiation by brand and premium vs. volume positioning
- Most innovative models by segment and top innovations by innovation strength
Analysis on Regional Level (examples)
- Selection by years or time periods
- Selection by OEMs
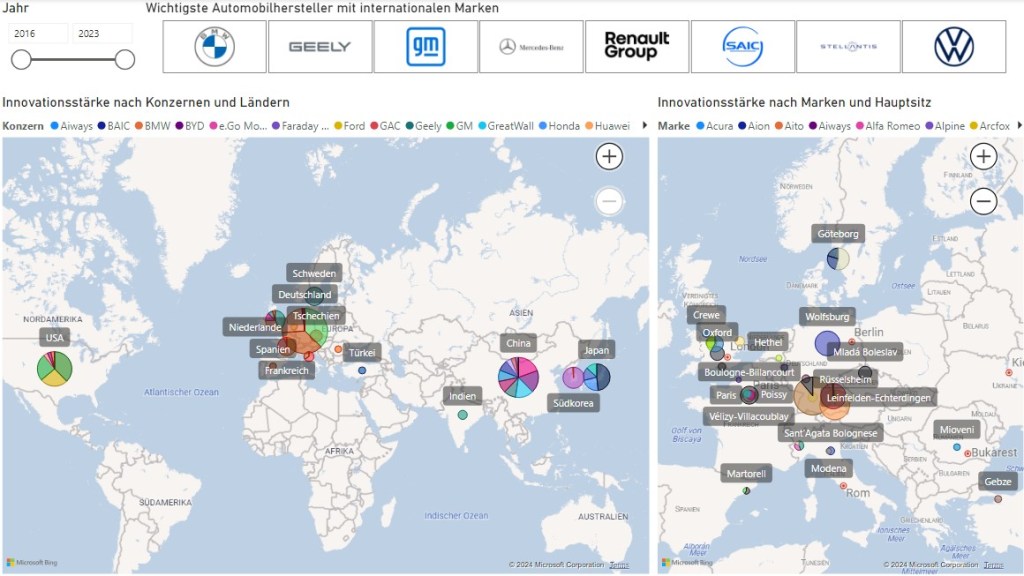
- Innovation strenth by OEMs and countrys
- Innovation strength by brands and headquarters